
The charging of electric vehicles (EVs) depends on the available infrastructure and factors such as temperature and state of charge, which are crucial for optimizing recharge times and trip efficiency.
Summary
1. Importance of Charging Infrastructure: The charging speed of an electric vehicle (EV) largely depends on the available charging infrastructure. This factor is crucial for the experience of long-distance driving, as charging times can vary significantly
2. DC Fast Charging: This type of charging, also known as level 3 charging, allows for faster recharging because the electricity is delivered directly to the battery without passing through the vehicle’s onboard charger. The charging speed is limited by the power the battery and the charger can handle.
3. Factors Affecting Charging Speed: The battery temperature and state of charge (SoC) are key determinants of charging speed. Batteries charge more slowly as they approach their maximum capacity and operate optimally at specific temperatures. Additionally, limits set by the EV manufacturer can also influence charging speed.
Introduction
Charging speed is one of the largest factors that influence the experience of driving long distances with an EV (electric vehicle). As opposed to an ICE (internal combustion engine) vehicle, the refueling time of an EV can vary wildly depending the vehicle and recharge infrastructure available.
Charging infrastructure is a hot topic at the moment in the electric vehicle world, notably the EU has included rules in the ‘Fit for 55’ package regarding recharging infrastructure [1] [2]. However, apart from the infrastructure, there is another factor which plays a major role in the time it takes to recharge, which we’ll dive into in this post.
Before moving forward it is important to highlight that this post focuses on DC fast charging, which is also called level 3 charging. When DC charging, the electricity bypasses the vehicle’s onboard charger (which converts the AC from the grid to DC, enabling charging from level 1 and 2 chargers). This means the charging power on the vehicle side is not limited to the power of the onboard charger; it is instead limited by the power the battery can accept and the power of the charger.
Charging a Battery
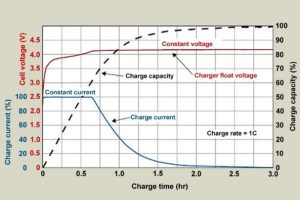
Charging a battery is an electrochemical reaction, at higher states of charge this reaction occurs more slowly. This leads to the charging power decreasing as the battery fills up. The following figure shows the typical charging process of a Li-ion battery. Note that as the battery reaches the maximum voltage (higher state of charge) the charge current drops, this translates to the charging power decreasing as the battery reaches its full capacity.
 [3]
[3]
As well as state of charge (SoC), battery charge speeds depend on the temperature of the battery. Battery performance is optimal at 25ºC, however for charging a higher temperature of 32ºC is ideal [4]. The EV will therefore manage the battery temperature by either increasing or decreasing the temperature of its battery pack as it is charging (or ideally, precondition the battery before the charge).
Charging EVs
When charging an EV the battery management system (BMS) will by define the maximum charge speed, however the EV manufacturer may want to impose more stringent limits on charging. Further limits can extend the battery life and therefore increase the serviceable life of the vehicle. Although not for the same use case, an example of artificially restricting the battery beyond BMS limits is the software range extension Tesla offers for their model Y vehicles [5].
The charging curve
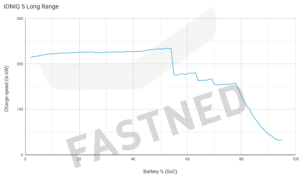
The previously discussed factors come together and affect you as a costumer in the charging curve. The charging curve is a graphic representing the power over an EV charging session, the most common representation has charging power on the y axis and SoC on the x axis (the charging curves of the Ioniq 5 LR ad Tesla model 3 LR are shown below as examples). The source of these graphs, Fastned, has a wealth of information on charge curves from a wide range of vehicles [6].
 [7]
[7]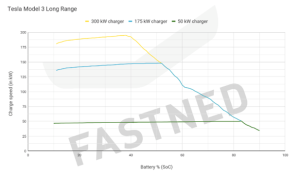 [8]
[8]
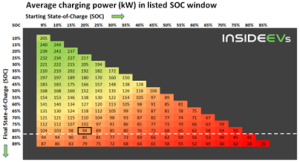
These charging curves are the key to determining how long you will be waiting at a fast charging station, as the advertised charging speed of the vehicle only represents the peak charging speed. More accurate representation of charging speeds can be found by interpreting this charge curve. A good example for this is Insideevs, who apart from providing the charging curve create average charging speed graphs (by start and end SoC). An example of these is shown below. 20 to 80% is usually the benchmark for charging times and speeds as the charge power drops dramatically after 80% SoC (as can be observed in the model 3 charging curve).
 [9]
[9]
Understanding the charging behavior of your EV can help you plan your charging stops better and save time at charging stations. It is usually more efficient to stay in the high power charging zone even if it implies adding an additional charging stop to your trip.
Charger limits
Apart from not having enough power, the speed of charging infrastructure can be limited by a rather unexpected factor; the charging cable itself. All charging cables have maximum current which they’re rated for, which is determined by the thickness of cable and potentially the cooling solution of said cable.
This raises a few questions; “Wouldn’t this limit be the same for all vehicles?, and why would a manufacturer produce a charger that can provide more power than the cable can handle?”
The vehicle part of the equation comes into play here, currently EV batteries are roughly categorized into two architectures; 400 Volt and 800 Volt. As the charger transfers power at the same voltage as the EV, the current draw at the same charging power will be double for a 400V EV compared to an 800V vehicle.
To note with battery architectures is that 400V and 800V are used as categories, not the exact nominal voltage of the vehicle’s battery. The chart below shows the spread in nominal voltages of all available EVs on ev-database.org [10] at the time of scraping (only vehicles who’s nominal voltage was listed were included).
Only a few vehicles’ nominal voltage was actually 800V, vehicles in the 700V range are usually grouped in the same 800V category. The same reasoning applies to 300V vehicles in the 400V architecture category.
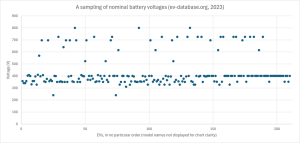 (data from [10], chart is original)
By Lucas Dewilde Cervelló
Why Charging Curves Matter
Bibliography
[1] “MEPs adopt new rules for more charging stations and greener maritime fuels | News | European Parliament.” Accessed: Jul. 02, 2024. [Online]. Available: https://www.europarl.europa.eu/news/en/press-room/20230707IPR02419/meps-adopt-new-rules-for-more-charging-stations-and-greener-maritime-fuels[2] “EU economy and society to meet climate ambitions,” European Commission – European Commission. Accessed: Jul. 02, 2024. [Online]. Available: https://ec.europa.eu/commission/presscorner/detail/en/IP_21_3541
[3] Battery University, “BU-409: Charging Lithium-ion,” Battery University. Accessed: May 21, 2024. [Online]. Available: https://batteryuniversity.com/article/bu-409-charging-lithium-ion
[4] “Ideal battery temperature? – EVcreate.” Accessed: Jul. 02, 2024. [Online]. Available: https://www.evcreate.com/ideal-battery-temperature/
[5] S. Alvarez, “Tesla to unlock extended range for vehicles affected in CA wildfires,” TESLARATI. Accessed: Jul. 02, 2024. [Online]. Available: https://www.teslarati.com/tesla-range-upgrade-ca-wildfires-elon-musk/
[6] Fastned, “How fast can my vehicle charge?,” Fastned FAQ. Accessed: Oct. 25, 2022. [Online]. Available: https://support.fastned.nl/hc/en-gb/articles/205694717-How-fast-can-my-vehicle-charge-
[7] “Hyundai,” Fastned FAQ. Accessed: Jul. 02, 2024. [Online]. Available: https://support.fastned.nl/hc/en-gb/articles/4405121276945-Hyundai
[8] “Tesla,” Fastned FAQ. Accessed: Jul. 02, 2024. [Online]. Available: https://support.fastned.nl/hc/en-gb/articles/360012178313-Tesla
[9] “2021 Tesla Model 3 LR AWD With 82 kWh Battery: Charging Analysis,” InsideEVs. Accessed: Jul. 02, 2024. [Online]. Available: https://insideevs.com/news/519382/tesla-model3-82kwh-charging-analysis/
[10] “Compare electric vehicles – EV Database.” Accessed: Jul. 02, 2024. [Online]. Available: https://ev-database.org/#sort:path~type~order=.rank~number~desc|rs-price:prev~next=10000~100000|rs-range:prev~next=0~1000|rs-fastcharge:prev~next=0~1500|rs-acceleration:prev~next=2~23|rs-topspeed:prev~next=110~350|rs-battery:prev~next=10~200|rs-towweight:prev~next=0~2500|rs-eff:prev~next=100~350|rs-safety:prev~next=-1~5|paging:currentPage=0|paging:number=10

